


























By Ellie Brooks
Open a fitness app after a week of wearing a modern tracker and you will likely meet a wall of numbers: heart rate variability, a readiness score, a strain score, sleep stages, skin temperature, blood oxygen, and a recovery percentage that changes depending on which app calculated it. For most people who exercise a few times a week and simply want to know whether it is a good day to push hard or a good day to go easy, that wall of numbers is not clarity. It is noise dressed up as insight.
This piece makes the case for the opposite approach: pick three metrics, log them consistently, and read them as trends rather than daily verdicts. The three are resting heart rate trend, sleep duration and consistency, and a simple subjective wellness or soreness rating. None of them require a wearable device, though a wearable can make the logging faster. All three have a long track record in sports science monitoring literature, and, notably, the subjective measure has repeatedly outperformed fancier objective ones at flagging changes in training status.
Why More Data Is Not the Same as Better Insight
The assumption behind most wearable dashboards is that more inputs produce a more accurate picture of recovery. The research on athlete monitoring does not support that assumption cleanly. A 2016 systematic review published in the British Journal of Sports Medicine, led by Anna Saw and colleagues at Deakin University, compared subjective self-reported measures (things like perceived fatigue, soreness, sleep quality, and mood) against commonly used objective markers such as heart rate measures, biochemical markers, and neuromuscular tests. Across the studies reviewed, subjective measures were more consistently sensitive to changes in training load and were quicker to reflect both acute and chronic fatigue than most objective tools examined. The review’s conclusion was blunt: self-reported measures showed superior sensitivity for monitoring training response compared with many of the objective measures researchers had assumed would be more reliable.
That finding matters for anyone deciding what to track, because it undercuts the common belief that a $400 chest strap or a multi-sensor ring is automatically a better recovery tool than a notebook and thirty seconds of self-reflection each morning. It is not that objective data is worthless. Heart rate trends carry real physiological signal. It is that objective data works best as a companion to, not a replacement for, how a person actually feels and functions. A 2025 narrative review in the journal Sports (Basel) examining training load and well-being monitoring in football reached a similar conclusion: well-being questionnaires combined with basic load tracking gave coaches earlier warning of fatigue accumulation than isolated physiological markers alone.
Three numbers, logged honestly every day for a month, tell you more than fifteen numbers logged inconsistently for a week.
There is also a practical cost to tracking everything that dashboards rarely mention: decision fatigue. When a person is staring at six colored scores each morning, each one nudging toward a slightly different verdict, the natural response is either to ignore all of them or to fixate on whichever number looks worst that day. Neither response helps. A pared-down system, tracked with discipline, tends to produce better decisions than a comprehensive system tracked with half-attention.
The Three Metrics Worth Logging
These three were not picked at random. Each one is cheap to collect, has a plausible physiological or behavioral link to recovery, and appears repeatedly in the athlete-monitoring literature as either a strong standalone signal or a strong contributor to a combined signal. Together they cover three different domains: cardiovascular strain (resting heart rate), restorative capacity (sleep), and the athlete’s own felt sense of readiness (subjective wellness).
Resting Heart Rate: The Original Recovery Number
Long before wearables existed, coaches asked athletes to take their morning pulse. The logic still holds. Resting heart rate rises when the body is under strain, whether from accumulated training load, incoming illness, dehydration, heat, alcohol, or psychological stress. A 2025 review in Sensors examining heart rate variability monitoring in athletes noted that basic heart rate measures, while less granular than HRV, remain a practical and low-burden entry point for recovery tracking, particularly for people without access to more sensitive tools or the statistical background to interpret them.
The key word is trend. A single morning reading of 62 beats per minute means almost nothing on its own; it only becomes informative once you know that your typical range is 54 to 58. What you are watching for is a sustained shift away from your personal normal, not a comparison to some population average or a friend’s number. Two or three elevated mornings after a demanding training block is expected and not alarming. A week-long climb that does not settle back down, especially paired with poor sleep and low wellness scores, is the kind of pattern worth listening to.
Sleep: Duration and Consistency Both Count
Sleep is probably the single most consequential recovery input, and it is also the one people most often reduce to a single number (“I got 7 hours”) without asking whether that sleep was consistent from night to night. Recent sleep science has pushed hard on this second point. A 2026 editorial in the journal Sleep, written by Jonathan Cedernaes and colleagues, argued that sleep regularity, meaning how stable a person’s sleep and wake timing is across the week, deserves the same level of attention that duration has historically received, since irregular timing has been linked to worse metabolic and cardiovascular outcomes independent of how many total hours were logged. A related 2026 methods paper in Sleep by Czeisler and colleagues focused specifically on standardizing how sleep regularity is measured and reported, reflecting how much interest this angle has generated in the field.
For exercisers, the practical version of this is straightforward. Two nights of 8 hours followed by a night of 5 does not average out to fine. Training on a body that has just had a chaotic sleep week tends to feel and perform worse than training on a body that has had five nights of a steady 7 hours, even if the total weekly hours are similar. There is also applied evidence specific to athletic performance: a 2026 study in Sports (Basel) by Broodryk and Broodryk found that a 14-day sleep hygiene intervention (consistent bed and wake times, reduced pre-bed light exposure, and a wind-down routine) improved aerobic performance and reduced anticipatory cortisol in university soccer players, and a companion 2026 study in the Journal of Functional Morphology and Kinesiology reported similar aerobic and anaerobic performance gains in female collegiate soccer players following the same protocol.
Logging both numbers, hours slept and how far bed/wake time drifted from your usual, gives a fuller picture than either number alone.
Subjective Wellness: The Metric That Keeps Outperforming Expectations
It can feel unscientific to write down “I feel like a 2 out of 5 today” and treat that as data worth acting on. The research suggests you should. Beyond the Saw et al. review already mentioned, a 2025 systematic review in Sports (Basel) on training load and well-being in football found that structured well-being ratings, covering fatigue, sleep quality, soreness, stress, and mood, tracked meaningfully with subsequent changes in training tolerance and injury risk, often ahead of when physiological markers shifted. A separate narrative review on internal and external load monitoring in rugby, published in Frontiers in Sports and Active Living in 2025, reached a comparable point: combining simple load tracking with athlete self-report consistently gave a more complete fatigue picture than load data alone.
The mechanism is not mysterious. A person’s felt sense of soreness, fatigue, and motivation integrates dozens of inputs (sleep, nutrition, hydration, stress, illness, mood) that no single biometric fully captures. It is a crude instrument in the sense that it is not measured by a sensor, but it is a remarkably comprehensive one in the sense that it reflects the whole system at once. The trick is rating it the same way every time so the numbers stay comparable across weeks, not adjusting the scale based on how forgiving you feel that day.
Where This Differs From HRV and Wearable Readiness Scores
It is worth being clear about what this approach is not arguing. Heart rate variability, the beat-to-beat variation in heart rhythm that reflects autonomic nervous system balance, is a legitimate and well-studied recovery marker, and readiness scores built by wearable brands (which typically blend HRV, resting heart rate, sleep staging, and sometimes body temperature into a single proprietary number) can be genuinely useful for people who already own the hardware and understand how to interpret day-to-day swings.
The case here is narrower: for someone deciding where to start, or for someone who has tried tracking everything and burned out on it, HRV and blended readiness scores are not the first place to put your attention. HRV requires more careful measurement conditions (position, time of day, breathing pattern, and often a dedicated chest strap or app) to be reliable, and its day-to-day noise can be hard to interpret without some statistical literacy. Wearable readiness scores add a further layer of opacity, since the underlying formula is usually proprietary and can change between software updates without notice. Resting heart rate, sleep, and subjective wellness are more transparent: you know exactly what went into the number because you generated it yourself.
None of that means HRV or readiness scores are bad tools. It means they are a reasonable second layer to add once the three foundational metrics are established as a habit, not the starting point.
Logging Without a Wearable
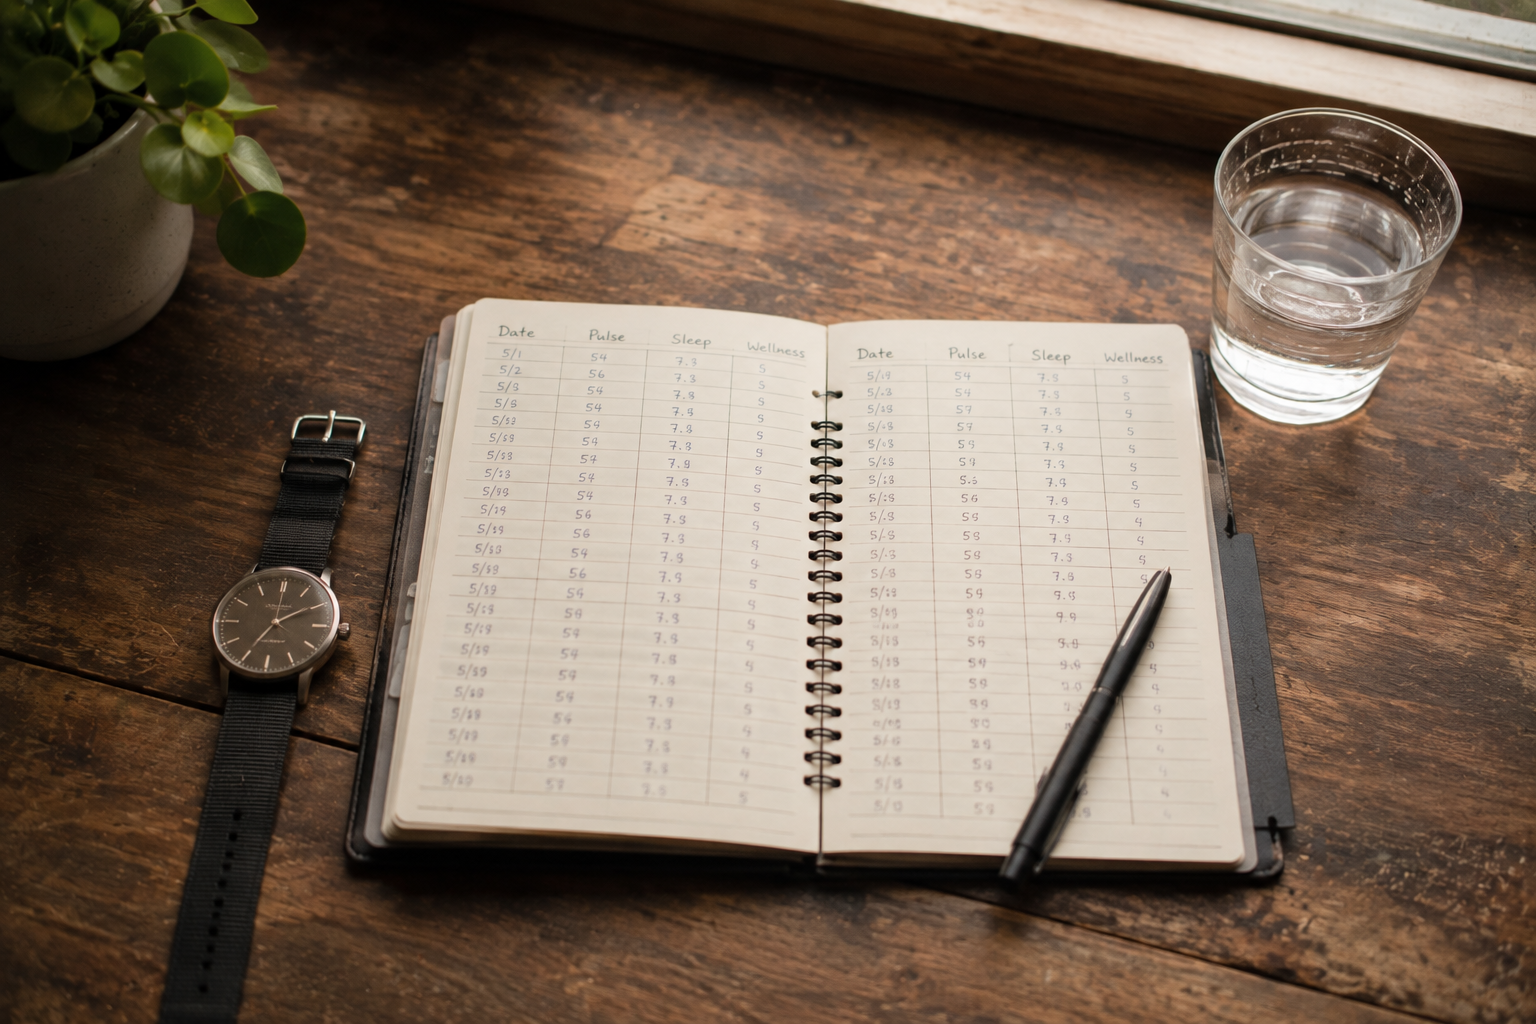
None of the three metrics above require a smartwatch, a ring, or a chest strap. A basic wristwatch or phone clock, a pulse count, and a pen are sufficient. Below is a simple paper log template you can copy into a notebook or print out. The goal is not precision to the decimal point; it is consistency day over day.
| Date | Waking Pulse (bpm) | Bed / Wake Time | Hours Slept | Wellness (1-5) | Soreness (1-5) | Notes |
|---|---|---|---|---|---|---|
Print this on a small notepad kept by your bed, or copy the columns into a phone notes app or a basic spreadsheet. What matters is filling it in at roughly the same time each day.
A few practical notes on the mechanics: take waking pulse before sitting up or checking your phone, since even mild activity or stress from a notification can bump the number. For bed and wake time, round to the nearest 15 minutes rather than chasing false precision. For the wellness and soreness ratings, write a one-word anchor next to your scale the first time you use it (for example, “3 = normal Tuesday-morning tired”) so future ratings stay calibrated to the same reference point.
Reading Trends, Not Single-Day Numbers
The most common mistake in recovery tracking is treating any single day’s number as a verdict. One rough night, one slightly elevated pulse, one soreness rating of 4, tells you almost nothing in isolation. Bodies fluctuate for reasons that have nothing to do with training: a late dinner, an argument, a warm bedroom, a cup of coffee too close to bedtime. The signal you actually want lives in the pattern across several days, not in any one entry.
A practical way to do this without software is a simple rolling average. At the end of each week, average your seven morning pulse readings, your seven sleep durations, and your seven wellness scores. Compare that weekly average to the previous week’s average. A single bad morning barely moves a seven-day average; a real accumulating trend moves it clearly. If you want more resolution, a 3-day rolling average (today plus the two days before) smooths out one-off noise while still reacting faster than a full week would.
A number only becomes useful once you know what your own normal looks like. Without a baseline, every reading is just a stranger.
Building Your Baseline
Before any of these numbers can flag a problem, you need to know your personal normal. This takes roughly two to three weeks of consistent logging, ideally including a mix of harder and easier training days so your baseline reflects real variation rather than one unusually calm stretch. During this period, resist the urge to react to every fluctuation. You are collecting reference data, not making decisions yet.
Once you have two to three weeks logged, calculate simple averages and ranges for each metric: typical waking pulse and its normal day-to-day spread, typical sleep duration and how much bed/wake timing usually drifts, and typical wellness and soreness scores on both hard-training and easy-training days. From that point forward, new readings get compared against this personal range rather than against any generic number from an article, a friend, or a wearable’s default target.
What a Concerning Trend Actually Looks Like
Once a baseline exists, a genuinely concerning pattern usually shows up as two or more of the three metrics drifting in the same unfavorable direction over three or more consecutive days: resting pulse creeping up, sleep shortening or becoming erratic, and wellness or soreness scores sliding down together. Any one metric moving alone, especially for a day or two, is normal variation. Multiple metrics moving together, and staying that way, is the pattern worth acting on, usually by scaling back training intensity or volume for several days and prioritizing sleep before pushing hard again.
It is also worth logging context alongside the numbers: illness symptoms, travel, unusual stress, alcohol, or a change in medication. These explain a surprising share of “concerning” trends and prevent overreacting to a pattern that has an obvious, temporary cause.
Common Mistakes When Tracking Recovery
A few habits quietly undermine even a well-designed three-metric system. The first is inconsistent timing: taking pulse at wildly different times or in different positions (lying down some days, sitting up others) introduces enough noise to hide a real trend. The second is skipping entries on bad days, which is exactly when the data matters most. The third is adjusting your subjective rating scale based on mood rather than a fixed anchor, so a “3” one month means something different than a “3” the next. The fourth is reacting to a single data point instead of waiting for a multi-day pattern, which tends to produce unnecessary rest days or, worse, ignored real warning signs once a person gets used to false alarms. The fifth is abandoning the log the moment training gets busy, which is precisely when tracking is most valuable.
None of these require sophisticated fixes. A fixed time and position for pulse-taking, a rule to log even on bad days, a written anchor for the wellness scale, and a habit of reviewing weekly averages rather than daily snapshots resolve most of them.
Frequently Asked Questions
Do I need a wearable device to track these three metrics well?
No. All three can be logged with a watch, a pen, and a notebook or basic spreadsheet. A wearable can automate the pulse and sleep-duration entries, but it is not required, and the subjective wellness rating has to come from you either way.
Why not just track HRV instead of resting heart rate?
HRV can be a sensitive marker, but it requires more careful, consistent measurement conditions to be reliable and is harder to interpret without some statistical background, since day-to-day swings are often large. Resting heart rate is simpler to measure accurately with nothing more than a watch and a pulse count, which makes it a more reliable starting point for most people before adding HRV as a secondary layer.
How long before these numbers actually mean something?
Plan on two to three weeks of consistent daily logging to establish your personal baseline range before treating any new reading as meaningful. Trends become genuinely informative once you are comparing weekly averages against your own established normal rather than against a single prior day.
Is sleep duration or sleep consistency more important?
Recent research suggests both matter, and somewhat independently. Getting enough total sleep hours matters, but recent sleep-science work has also emphasized that irregular bed and wake timing carries its own cost, separate from total hours. Logging both duration and timing gives a more complete picture than tracking either alone.
What should I do when all three metrics show a concerning trend at once?
Treat it as a signal to scale back training intensity or volume for several days, prioritize sleep, and look for an explanation such as illness, travel, or unusual stress. If the pattern persists for more than a week or two without an obvious cause, or if soreness is severe or localized, it is reasonable to check in with a healthcare provider rather than continuing to self-manage through training adjustments alone.
Can I add more metrics later, or should I stick to three forever?
Three is a starting discipline, not a permanent ceiling. Once these three are a genuine daily habit and you understand how to read your own trends, adding a fourth metric such as HRV or a wearable readiness score can be reasonable. The point of starting narrow is building a habit that survives busy weeks, not restricting you permanently.
References
- Saw AE, Main LC, Gastin PB. Monitoring the athlete training response: subjective self-reported measures trump commonly used objective measures: a systematic review. Br J Sports Med. 2016;50(5):281-291. https://doi.org/10.1136/bjsports-2015-094758
- Esco MR, Fields AD, Mohammadnabi MA, Kliszczewicz BM. Monitoring Training Adaptation and Recovery Status in Athletes Using Heart Rate Variability via Mobile Devices: A Narrative Review. Sensors (Basel). 2025;26(1):3. https://doi.org/10.3390/s26010003
- Afonso P, Forte P, Branquinho L, Ferraz R, Garrido ND, Teixeira JE. Shaping Training Load, Technical-Tactical Behaviour, and Well-Being in Football: A Systematic Review. Sports (Basel). 2025;13(8):244. https://doi.org/10.3390/sports13080244
- Lv X, Yang J, Suo L, Han W. The role and application of internal and external load indicators in monitoring fatigue in rugby players, a narrative review. Front Sports Act Living. 2025;7:1654577. https://doi.org/10.3389/fspor.2025.1654577
- Broodryk A, Broodryk R. A 14-Day Sleep Hygiene Intervention Improves Aerobic Performance and Reduces Anticipatory Cortisol in University Soccer Players. Sports (Basel). 2026;14(5):179. https://doi.org/10.3390/sports14050179
- Pretorius E, Kramer M, Broodryk A. Sleep Hygiene Improves Aerobic and Anaerobic Performance Independent of Cortisol Mediation in Female Collegiate Soccer Players. J Funct Morphol Kinesiol. 2026;11(2):187. https://doi.org/10.3390/jfmk11020187
- Cedernaes J, Sielaff B, Benedict C. Time to regularize sleep regularity. Sleep. 2026;49(4):zsaf289. https://doi.org/10.1093/sleep/zsaf289
- Czeisler MÉ, Leota J, Le F, Campbell-Brown B, Rajaratnam SMW, Pase MP, Kramer DB. Comparison of Sleep Regularity Index scores calculated by open-source packages and implications for outcomes research. Sleep. 2026;49(4):zsaf299. https://doi.org/10.1093/sleep/zsaf299