






















By Emily Harrison
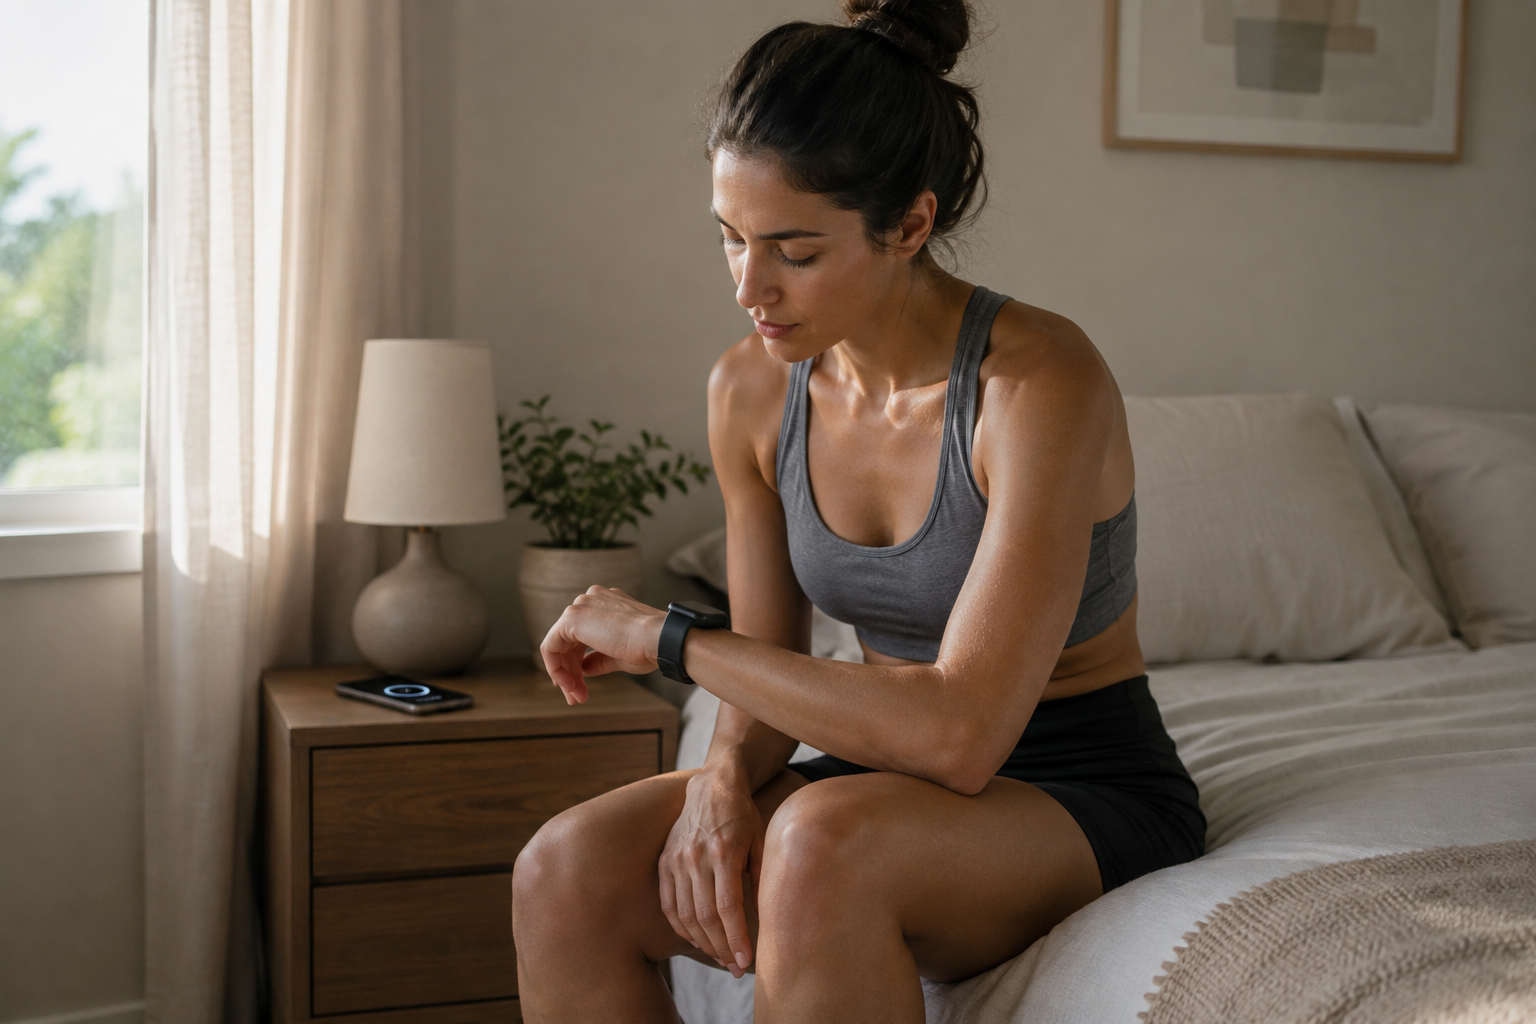
Your watch says 41 percent. Red zone. The little icon on the app is a color that, evolutionarily speaking, humans are wired to treat as a warning. So you cancel the workout, message your training partner “not today,” and spend the rest of the morning wondering if you’re coming down with something.
Maybe you are. Or maybe you stayed up late finishing a good book, drank wine with dinner, and slept in a room that was two degrees warmer than usual. A readiness score cannot tell the difference between those explanations. It can only tell you that a handful of overnight signals moved in a direction the algorithm associates with lower recovery, and it packages that into a single number designed to feel authoritative.
That packaging is the problem this guide is about. Readiness and recovery scores from devices like Whoop, Oura, and Garmin are genuinely useful summaries of overnight physiology. They are not verdicts, and treating a single-number output as a command — train, or don’t — throws away information the number was never built to carry alone. What follows is a practical, step-by-step way to read the number as one input among several rather than as an instruction to obey.
What a Readiness Score Actually Measures
Every mainstream wearable readiness metric is built from a small set of overnight physiological signals, weighted and combined by proprietary formulas the manufacturers do not fully disclose. The inputs, though, are public knowledge and worth understanding individually before you look at the composite number again.
| Input Signal | What It Reflects | Known Limitation |
|---|---|---|
| Heart rate variability (HRV), usually as rMSSD | Beat-to-beat timing variation, used as a rough proxy for autonomic nervous system balance | Naturally noisy night to night; influenced by alcohol, illness, heat, altitude, and even the sensor’s placement, not just training stress |
| Resting heart rate (RHR) | Lowest sustained heart rate during sleep, a general fitness and fatigue marker | Slow to change day to day; a single elevated night can reflect digestion, caffeine timing, or room temperature rather than fatigue |
| Sleep duration and staging | Total sleep time and estimated time in light, deep, and REM stages | Wrist and finger sensors estimate stages from movement and pulse rather than brainwaves, so stage-by-stage accuracy is meaningfully lower than total-time accuracy |
| Skin/body temperature deviation | Overnight temperature compared with your own rolling baseline, not an absolute reading | Sensitive to room temperature, bedding, alcohol, and the menstrual cycle, all of which can move it independent of illness or overtraining |
| Respiratory rate | Breaths per minute during sleep, generally stable for a given person | Usually contributes little to the score unless it spikes; on its own it rarely distinguishes hard training from a cold |
None of these signals are measured with a clinical-grade sensor. They are measured with a photoplethysmography (PPG) light sensor pressed against skin, which is good enough for population-level trend tracking but noisier than an electrocardiogram (ECG) for any single night. That gap between “useful trend” and “precise daily measurement” is the crux of how to read these scores responsibly, and it is worth grounding in the actual validation research rather than marketing copy.
How the Major Platforms Build Their Score, in General Terms
Different brands weight the same handful of inputs differently, and describing the general approach (without endorsing any single product) helps explain why two devices worn on the same night can disagree.
Whoop’s recovery score is presented as a daily percentage built primarily from HRV, resting heart rate, sleep performance (how much sleep you got relative to how much your body was calculated to need), and respiratory rate, then sorted into three color zones: roughly 67 to 99 percent (green, “primed to perform”), 34 to 66 percent (yellow, “ready for moderate strain”), and 1 to 33 percent (red, “rest is likely what your body needs”). Whoop has reported that the average recovery score across its user base sits around the upper half of the yellow zone, which is a useful reminder that “yellow” is a normal, common state rather than a problem to solve every day.
Oura’s readiness score works from a similar input set — HRV balance, resting heart rate, sleep balance, body temperature, and recent activity balance — compared against your own rolling personal baseline rather than a fixed population norm, which is one reason the same absolute HRV number can produce different scores for different people. Garmin’s Body Battery instead models energy as a depleting and recharging resource across the full day and night, drawing on stress-tracking heart rate data, not just an overnight snapshot, which makes it behave more like a running tally than a single morning verdict. The common thread: every platform is compressing several imperfect signals into one number, and the compression method is different, and proprietary, for each.
What the Validation Research Actually Shows
Independent validation studies, as opposed to manufacturer marketing pages, give a more mixed picture than “these devices are accurate” or “these devices are useless.” Both extremes are wrong, and the details matter for how much weight you put on a single day’s number.
A 2025 study published in Physiological Reports compared five consumer wearables (Garmin Fenix 6, Oura Generation 3, Oura Generation 4, Polar Grit X Pro, and Whoop 4.0) against an electrocardiogram reference across 536 nights of sleep in 13 healthy adults. Accuracy varied substantially by brand. For resting heart rate, Oura Generation 4 showed the closest agreement with the ECG reference (Lin’s concordance correlation coefficient of 0.98, mean absolute percentage error of about 1.9 percent), while Polar showed the weakest agreement (concordance of 0.86, mean error around 2.7 percent). For HRV specifically, the spread was wider: Oura Generation 4 again led (concordance 0.99, mean error about 6 percent), Whoop showed moderate agreement (concordance 0.94, mean error about 8 percent), and Polar showed the largest error, with a mean absolute percentage error above 16 percent. The authors’ conclusion was straightforward: interdevice accuracy differs enough that the same physiological night can produce meaningfully different HRV readings depending on which wrist or finger sensor recorded it (Dial et al., 2025).
Sleep-stage estimation carries its own caveats. A 2026 systematic review and meta-analysis in Behavioral Sleep Medicine pooled data from sixteen studies comparing wearables against laboratory polysomnography, the clinical gold standard that reads sleep stages from brainwave activity. It found that wearables, as a category, tended to overestimate total sleep time and sleep efficiency while underestimating time spent awake after sleep onset, with substantial variability between devices and no single device performing best across every metric (Agostinho et al., 2026). A separate 2025 meta-analysis in OTO Open, focused specifically on the Oura Ring against polysomnography and actigraphy across six studies, found no statistically significant differences for total sleep time, sleep efficiency, or several other standard sleep parameters, which is a genuinely reassuring result for that device’s global sleep-summary numbers even as stage-by-stage precision remains an open question (Khan et al., 2025).
Even HRV measurement tools built for athletes show meaningful device-to-device disagreement. A 2025 study in Frontiers in Physiology tested a smartphone camera-based HRV app against a Polar H10 chest strap and ECG in 37 trained participants and found good-to-excellent reliability for each device individually, but the chest strap consistently showed the lowest error against the ECG reference, reinforcing that not all consumer-grade HRV capture methods are interchangeable (Johansson et al., 2025).
Validation Limitations Worth Remembering
- Accuracy is device-specific. Studies consistently find one brand out-performing another on the same metric on the same night, so “wearables are accurate” is not a statement you can generalize across products (Dial et al., 2025).
- Sleep-stage detection is less reliable than total-sleep-time detection. Treat “you got 6 hours 40 minutes of sleep” with more confidence than “you got 52 minutes of deep sleep” (Agostinho et al., 2026).
- Most validation studies use small samples, often healthy young adults in a lab or home setting, which may not generalize to your age group, health status, or sleeping environment.
- HRV has substantial natural night-to-night variability independent of training or recovery, so a single low reading is a data point, not a diagnosis.
- None of these devices are cleared as diagnostic medical instruments. They are consumer wellness tools, and the studies validating them evaluate agreement with reference equipment, not clinical outcomes.
Why the Score Is an Input, Not an Instruction
Sports science has looked directly at the question of whether an objective metric like HRV should override an athlete’s own subjective sense of how they feel, and the honest answer is that neither source is complete on its own. Subjective wellness questionnaires, the kind that ask an athlete to rate sleep quality, muscle soreness, stress, and mood on a simple scale, have repeatedly shown value for tracking training status in team-sport and endurance settings, in some cases tracking meaningful changes in fatigue and workload as well as, or better than, purely objective metrics (Rossi et al., 2022). That does not mean subjective ratings are more “true” than a heart rate signal; it means they capture different information, including sources of stress a chest sensor cannot see: a stressful day at work, a poor night’s sleep from a crying infant, low motivation, or early muscle soreness from a new exercise.
Three separate categories of information are relevant to any single training decision, and a readiness score only ever covers one of them cleanly:
- Physiological signal (the score). Overnight HRV, RHR, sleep, and temperature trend, filtered through a proprietary algorithm and compared to your personal baseline.
- Subjective feel. Muscle soreness, motivation, joint pain, energy level, and general mood, none of which a wrist sensor measures directly.
- Life and training context. Where you are in a training block, whether a hard session or race is scheduled soon, how much sleep debt you are carrying, travel, illness symptoms, and non-training stress such as work deadlines or caregiving demands.
A framework that only reads the first category is, in effect, throwing away two-thirds of the relevant information every single morning.
The Decision Framework: Score, Feel, and Context
The visual below is a simplified map of how those three inputs should combine into a training decision. None of the three overrides the others automatically; the goal is to notice when they agree and, more importantly, to have a plan for what to do when they don’t.
Step-by-Step: Reading the Score Without Obeying It
- Look at the trend, not the single number. Open your app’s multi-week HRV and RHR history before you look at today’s score in isolation. A 41 percent readiness score means something different if your last five scores were 38, 40, 39, 42, and 41 (a stable, if low, baseline) than if they were 78, 75, 80, 76, and 41 (a real one-day drop). Because HRV has substantial natural night-to-night variability, a single reading below your rolling average by a small margin is normal noise, not a signal.
- Identify what changed last night. Before assuming the drop reflects training fatigue, run through the obvious confounders: alcohol, a later or earlier bedtime, an unusually warm room, a big meal close to sleep, travel, illness symptoms, or a stressful evening. HRV and skin temperature are sensitive to all of these independent of fitness or recovery status.
- Rate your subjective feel deliberately, not automatically. Spend thirty seconds on a simple check: muscle soreness (none to severe), joint discomfort, energy level, and motivation to train. Write it down or use your app’s journal feature if it has one. Subjective wellness tracking has repeatedly shown real value for flagging fatigue trends in athletes, so treat this step as data collection, not a formality (Rossi et al., 2022).
- Place today inside your training plan, not in isolation. A low score the day before a scheduled rest day requires no decision at all. A low score the morning of a long-planned key workout or race is a genuinely harder call, and that is exactly when the other two inputs matter most.
- Check for conflict between the three inputs. If the score, your subjective feel, and your context all point the same direction, the decision is easy. Score low, body feels heavy, no important session scheduled: take the easy day or rest. Score fine, body feels fine, key session on the calendar: proceed as planned. The framework earns its keep on the days these three disagree.
- When they conflict, default toward the more conservative but not the most extreme reading. If the score is low but you feel genuinely good and the day is not a key session, a moderate effort rather than an all-out one is usually the sensible middle path. If the score is high but you feel unusually sore or run-down, trust the subjective signal. Scores cannot see soreness, and this is one of their clearest blind spots.
- Decide, then reassess mid-session rather than locking in. Start the planned session at an easier effort and give yourself permission to build into it or back off after ten to fifteen minutes, based on how the body actually responds. This turns an irreversible morning decision into a reversible, in-progress one.
- Log the outcome. Note what you decided and how the session actually went. Over months, this creates a personal record of how well your particular device’s score predicts your particular training days, which is more useful than any published validation study for your individual case.
Two Worked Examples
Example one: the deceptively low score. Marathon training, ten weeks out from race day, easy Tuesday run scheduled. The score reads 45 percent, well under a typical 70s baseline. Reviewing the trend shows this is a single-day dip, not a slide. The likely cause: a late dinner with wine the night before. Subjective feel is normal, no soreness, decent energy. Context: today is an easy day already, nothing is lost by running as planned. Decision: proceed with the easy run as scheduled, and treat the score as confirming what the calendar already called for rather than as new information requiring a change.
Example two: the deceptively high score. Strength block, week three, a heavy squat session scheduled. The score reads 82 percent, comfortably in the green zone. But subjective feel flags something the score cannot: sharp, specific soreness in one knee from an awkward step the day before, plus poor sleep quality despite a normal duration reading. Context: this is not a key competition day, and nothing is lost by adjusting. Decision: keep the session but substitute a lower-impact lower-body movement for back squats, and treat the high score as permission to train, not as a mandate to run the original plan unmodified.
Building a Personal Baseline That Makes the Score More Useful
A readiness score becomes more informative the longer you use the same device, because most platforms compare each night against your own rolling average rather than a fixed population number. That means the first few weeks with a new device produce the least reliable readings, simply because there is not yet enough personal history to compare against. A few habits speed up how quickly the score becomes useful.
Wear the device consistently, including on rest days and weekends, since gaps in the data make the rolling baseline less stable. Keep bedtime and wake time reasonably regular where your schedule allows, because irregular sleep timing adds noise that has nothing to do with training load. Note anything unusual in a simple daily log: alcohol, travel, illness, poor sleep environment, or a late meal, so that months later you can look back and separate real fatigue trends from one-off disruptions. Over eight to twelve weeks, most people start to notice a personal pattern: a HRV number that once looked alarmingly low in week one turns out to be a completely ordinary Tuesday reading once thirty or forty nights of data exist.
This is also where the earlier point about device-specific accuracy becomes practical rather than academic. If you switch from one brand to another, do not expect the new score to mean the same thing as the old one, even on an identical night. Validation research has shown real accuracy differences between platforms, so a fresh baseline, not a direct comparison to your old numbers, is the right way to interpret the first month on a new device (Dial et al., 2025).
Frequently Asked Questions
Is a low readiness score ever a reason to see a doctor rather than just rest?
Yes, when it comes with symptoms rather than just a number. A persistently elevated resting heart rate or unusually low HRV alongside fever, chest pain, prolonged unexplained fatigue, or shortness of breath warrants medical attention regardless of what the app suggests. Wearable scores are wellness tools, not diagnostic devices, and none of the underlying research treats them as a substitute for clinical evaluation.
Why do two different devices give me different readiness scores on the same night?
Because they use different sensors, different algorithms, and different personal baselines. Validation research comparing five wearables against an ECG reference over 536 nights found accuracy varied meaningfully by brand for both resting heart rate and HRV, with some devices showing mean errors several times larger than others on the same nights (Dial et al., 2025). A score is not a universal physical constant; it is one company’s interpretation of your signals.
Should beginners even pay attention to readiness scores?
Cautiously, and mostly for the trend rather than daily numbers. Beginners have less data history to build a personal baseline against, so early scores are less individually calibrated. It is generally more useful for a new exerciser to focus on consistent sleep, gradual training progression, and basic soreness and energy check-ins, and to treat the score as a secondary confirmation once several weeks of personal baseline data exist.
Can stress from work or life outside training lower my score even if I didn’t train hard?
Yes. HRV and resting heart rate respond to the autonomic nervous system broadly, not specifically to exercise load. Psychological stress, poor sleep from non-training causes, illness, and alcohol can all move the same underlying signals that training stress moves, which is exactly why context matters as much as the number itself.
How much should sleep-stage data (deep sleep, REM) factor into a training decision?
Less than total sleep time and how you feel. Meta-analytic research comparing wearables against laboratory polysomnography found wearables reasonably estimate total sleep time and sleep efficiency, but stage-by-stage detection (deep versus REM versus light) is less consistent across devices and studies (Agostinho et al., 2026). Treat stage breakdowns as directional and low-confidence rather than as precise data to plan around.
What is the single biggest mistake people make with readiness scores?
Treating a one-day reading as a diagnosis instead of checking it against the trend, ignoring how their body actually feels, and forgetting where the day sits in their broader training plan. The score is one of three inputs into a training decision, not the whole decision.
References
- Dial, M.B., Hollander, M.E., Vatne, E.A., Emerson, A.M., Edwards, N.A., and Hagen, J.A. (2025). Validation of nocturnal resting heart rate and heart rate variability in consumer wearables. Physiological Reports. DOI: 10.14814/phy2.70527
- Khan, S., Ibrahim, A.F., Vasudevan, S.S., Quatela, O.E., Nanu, D.P., and Carr, M.M. (2025). The Oura Ring versus medical-grade sleep studies: a systematic review and meta-analysis. OTO Open. DOI: 10.1002/oto2.70181
- Agostinho, M., Borges, M., Pereira, T., Borges, D.F., and Soares, J.I. (2026). Are wearable sleep-tracking devices reliable alternatives to polysomnography? A systematic review and meta-analysis. Behavioral Sleep Medicine. DOI: 10.1080/15402002.2026.2673893
- Johansson, H., Adderley, E., Clarke, S., McIntyre, P., Reilly, G., Caulfield, B., and Holden, S. (2025). An observational study of the reliability and concurrent validity of heart rate variability devices in athletes. Frontiers in Physiology. DOI: 10.3389/fphys.2025.1707318
- Rossi, A., Perri, E., Pappalardo, L., Cintia, P., Alberti, G., Norman, D., and Iaia, F.M. (2022). Wellness forecasting by external and internal workloads in elite soccer players: a machine learning approach. Frontiers in Physiology. DOI: 10.3389/fphys.2022.896928
- WHOOP. How Does WHOOP Recovery Work? WHOOP official resource on recovery score calculation and color zones. whoop.com/thelocker/how-does-whoop-recovery-work-101