























By Emily Harrison
A step counter is easy to love. It gives a single, tidy daily number, and that number is simple to compare against yesterday’s total or a round goal like 10,000. But a step count treats a slow amble through a parking lot the same as a brisk, arm-swinging walk up a hill, and it treats a walk taken after a full night of sleep the same as one taken on three hours of rest. The count goes up either way, so the number can climb for weeks while the body underneath it is not actually getting fitter.
Researchers who study wearable data have started to notice the same gap. A 2025 analysis of more than 33,000 adults in the UK Biobank cohort found that the way steps were distributed across the day predicted cardiovascular outcomes better than the daily total did. Adults who took most of their steps in continuous bouts of 10 to 15 minutes had roughly a 4 percent ten-year risk of a cardiovascular event, compared with about 9 percent for adults who accumulated similar totals in bursts shorter than five minutes. Two people with identical step counts can carry meaningfully different risk profiles, which is a strong signal that the count alone is not telling the full story.
This guide walks through a set of markers that fill in what step count leaves out: pace over a fixed distance, heart rate at that pace, how hard the walk feels, tolerance for inclines, and how quickly the heart rate settles afterward. None of these require lab equipment. Most can be tracked with a phone, a basic fitness watch, and a notebook or spreadsheet. The goal is a small set of numbers that, tracked together over months, show whether walking capacity is actually improving.
Why raw step count misses the point of “progress”
Step count measures volume, not capacity. Volume matters for general health; there is solid evidence that moving more across the day lowers all-cause mortality risk compared with prolonged sitting. But once someone is already walking regularly, the question changes. The person who wants to know whether their walking habit is building fitness needs a marker of how efficiently the body handles a given amount of walking, and that is a capacity question, not a volume question.
Three problems come up repeatedly when step count is used as the only progress marker.
- It cannot separate intensity from duration. 8,000 steps taken at a leisurely stroll and 8,000 steps taken at a fast clip produce the same total, even though the cardiovascular demand is very different.
- It does not account for terrain. A flat 4,000-step loop and a hilly 4,000-step loop place very different loads on the heart and legs, but the step counter cannot tell them apart.
- It plateaus even when fitness keeps improving. Once someone hits a comfortable daily total, they tend to stop increasing it, so the number stalls even as the body becomes able to hold a faster pace at a lower heart rate.
The markers below are built to catch exactly what the step counter misses: intensity, terrain-adjusted effort, and internal load. Together they describe something exercise physiologists call walking economy, the amount of oxygen and cardiac effort a body spends to sustain a given walking speed. Two walkers can cover the same route at the same pace while one of them is working at 60 percent of capacity and the other at 85 percent. A step counter cannot tell them apart, but pace, heart rate, and perceived exertion together can, which is exactly why this guide leans on those markers instead of the daily total.
Five markers that show walking progress
1. Pace over a fixed distance
Pace is the most direct capacity marker available without any special equipment. Pick a route of known distance, ideally flat and roughly the same each time, and record the time it takes to walk it at a natural, sustainable effort rather than a rush. A half-mile loop, a lap around a local park, or a fixed segment of a regular route all work.
Retest the same route every one to two weeks under similar conditions (similar time of day, similar footwear, similar weather where possible). A pace that drops from, say, 16 minutes per mile to 14 minutes per mile over two months at the same perceived effort is a clear sign of improved walking economy, meaning the body is now producing the same speed with less relative strain. Frontiers in Sports and Active Living has published work specifically on estimating walking speed from wearable sensor data in free-living conditions, underscoring that gait speed measured outside a lab is both feasible and a meaningful marker of function.
2. Heart rate at a fixed pace
Pace alone can be misleading if effort changes day to day, so pairing it with heart rate closes the loop. On the same test route, note the average heart rate for the walk (a chest strap gives the cleanest reading, but a wrist-based optical sensor is adequate for tracking trend over time). If the same pace produces a lower average heart rate a month later, the heart is moving the same amount of blood with less work, a hallmark of the type of cardiovascular adaptation that structured walking is meant to produce.
A useful way to frame this is the relationship between step rate and heart rate, sometimes called a fitness slope in wearable research. A study published in npj Digital Medicine that tracked 22 adults using Fitbit devices over an average of 18 weeks found that a steeper, healthier relationship between step rate and heart rate correlated with lower levels of NT-proBNP, a biomarker of cardiac strain. The study population was small and specific to a lung condition, but the underlying logic, that the step rate to heart rate relationship carries clinical information beyond either metric alone, applies broadly to anyone tracking walking fitness.
3. Perceived exertion trends
Not everyone has access to a heart rate monitor, and perceived exertion turns out to be a remarkably reliable stand-in. The Borg Rating of Perceived Exertion scale, which runs from 6 to 20 (or a simplified 0-to-10 version in many apps), asks a walker to rate how hard the effort feels. A meta-analysis of validity studies found consistent, moderate-to-strong correlations between Borg ratings and objective physiological measures such as heart rate and oxygen consumption across healthy adults, which is why the scale remains standard in cardiac rehabilitation and exercise physiology settings.
To use it for progress tracking, rate perceived exertion on the same test route at the end of every walk, using the same scale each time. A route that once felt like a 14 (“somewhat hard”) and now feels like an 11 (“fairly light”) at the same pace is a real signal of improved capacity, even with no wearable device involved.
4. Incline and hill tolerance
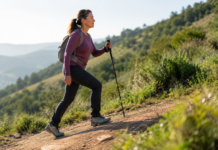
Flat-ground pace only tells part of the story once someone starts encountering real-world terrain. Hill tolerance, meaning the ability to hold a steady pace and breathing rate on an incline without stopping, tracks leg strength and aerobic capacity together in a way flat walking does not.
Choose a short, consistent hill or a treadmill set to a fixed incline (5 to 8 percent is a reasonable starting grade for most walkers). Track three things: the pace maintained up the hill, whether a stop was needed to catch breath, and the perceived exertion rating at the top. Progress shows up as a faster climb, fewer stops, and a lower exertion rating for the same grade over successive months.
As an example, a walker who needs 6 minutes and one rest stop to climb a quarter-mile, 6-percent grade in week one, and who covers the same climb in 5 minutes without stopping by week ten, has made a measurable gain in leg strength and aerobic capacity even if their flat-ground pace barely moved. Hills expose limitations that flat routes hide, which is why this marker is worth tracking on its own rather than folding it into the flat-route pace number.
5. Recovery time
How quickly the heart rate comes back down after effort is one of the more clinically established markers of cardiovascular fitness. Heart rate recovery, typically measured as the drop in beats per minute during the first one to two minutes after stopping exercise, is used in cardiac rehabilitation partly because it reflects how well the autonomic nervous system reasserts control after exertion. Research on the six-minute walk test, a standard clinical assessment, has found that a prolonged, sluggish heart rate recovery is an independent predictor of future cardiac events in people with heart failure, separate from how far they walked.
For everyday tracking, stop at the end of a brisk walking segment, note the heart rate immediately, then check it again after 60 seconds. A larger drop (for example, moving from a 40 beats-per-minute drop to a 55 beats-per-minute drop over several months) suggests better recovery capacity. This number tends to shift more slowly than pace or perceived exertion, so it is best tracked monthly rather than after every walk.
Metrics comparison at a glance
| Marker | What it captures | Tools needed | Sign of progress |
|---|---|---|---|
| Pace over fixed distance | Walking economy and speed capacity | Phone GPS or a measured route, timer | Faster time at the same effort |
| Heart rate at fixed pace | Cardiovascular efficiency | Wrist or chest heart rate monitor | Lower average heart rate, same pace |
| Perceived exertion (RPE) | Subjective effort and fatigue trend | Borg scale or 0-10 scale, no device | Lower rating at the same pace |
| Incline tolerance | Leg strength plus aerobic capacity | Fixed hill or treadmill incline setting | Faster, unbroken climb, lower RPE |
| Heart rate recovery | Autonomic nervous system fitness | Heart rate monitor, 60-second timer | Larger heart rate drop in 60 seconds |
A step-by-step method for tracking real progress
The five markers above work best when collected in a consistent, repeatable routine rather than randomly. Here is a practical sequence for setting that up.
- Pick one test route. Choose a route between a half mile and one mile, mostly flat, that can be walked at roughly the same time of day. Avoid routes with heavy traffic light stops that would distort timing.
- Pick one hill or incline setting. A short, repeatable climb (or a treadmill at a fixed grade) becomes the incline-tolerance test. Keep the grade and distance identical every time.
- Establish a baseline in week one. Walk the flat route once and record time, average heart rate, ending perceived exertion, and 60-second heart rate recovery. Walk the incline test once and record the same four data points.
- Repeat both tests every 10 to 14 days. More frequent testing adds noise from day-to-day variables like sleep and weather; less frequent testing makes trends hard to see. Ten to fourteen days is a reasonable middle ground for most walkers.
- Log the numbers somewhere durable. A simple spreadsheet with a column for each marker and a row for each test date works well. The template below is a minimal version that can be copied into any notes app or spreadsheet.
- Review the trend monthly, not daily. Individual test days will vary with sleep, heat, and stress. Looking at a rolling four- to six-week trend line filters out that noise and reveals the real trajectory.
- Adjust training based on which marker is lagging. If pace and perceived exertion are improving but recovery time is not, that often points toward needing more easy, low-intensity walking volume. If recovery is strong but pace is stalled, adding interval-style surges (alternating faster and slower segments) tends to move pace more directly.
Walking Progress Tracking Template
Copy this into a notes app or spreadsheet and fill in one row every 10-14 days:
Date: ____________
Flat route time: ______ minutes for ______ miles
Average heart rate (flat route): ______ bpm
Perceived exertion, end of flat route (0-10 or 6-20): ______
Incline test time: ______ minutes, stops needed: ______
Perceived exertion, top of incline: ______
Heart rate immediately after incline: ______ bpm
Heart rate 60 seconds later: ______ bpm (recovery = difference)
Notes (sleep, heat, footwear, how it felt): ____________
How to read the trend over months, not days
Single data points are noisy. A hot, humid day can push heart rate up by 10 to 15 beats per minute at the exact same pace compared with a cool morning, and a short night of sleep can make a familiar hill feel far harder than it did the week before. None of that reflects a real change in fitness, so the goal is to look at direction across several data points rather than reacting to any one test.
A practical way to do this is to plot each marker against test date and draw a simple trend line by eye, or use a spreadsheet’s built-in trendline function. Over an eight- to twelve-week span, look for:
- A gradual downward slope in pace time on the flat route, even with occasional up-ticks on bad-weather days.
- A gradual downward slope in average heart rate at that same pace, which is the clearest sign of genuine cardiovascular adaptation.
- A gradual downward slope in perceived exertion for both the flat route and the incline test.
- A gradual upward trend in heart rate recovery, meaning a larger drop in the 60 seconds after stopping.
It is common for these markers to improve at different speeds. Perceived exertion and pace often shift within the first four to six weeks of consistent walking. Heart rate at fixed pace tends to lag a few weeks behind that. Heart rate recovery is usually the slowest to move and may take two to three months of consistent walking before a clear shift appears. Plateaus are also normal; a marker can hold flat for three or four testing cycles and then move again once the body adapts to a new training stimulus, such as adding hill work or a faster segment.
If every marker stalls for more than six to eight weeks with no improvement, that is usually a signal to change something about the walking routine itself, most often the pace, the incline, or the total weekly volume, rather than to keep repeating the same walk and expecting a different trend line.
It also helps to weight the markers differently depending on the underlying goal. Someone training primarily for cardiovascular health might treat heart rate at fixed pace and recovery time as the two markers that matter most, since both reflect how the heart is adapting. Someone rebuilding strength and mobility after a period of inactivity might weight incline tolerance and perceived exertion more heavily, since those two track functional capacity in daily life, such as climbing stairs or carrying groceries up a slope. There is no single correct hierarchy; the point is to decide in advance which one or two markers matter most for the goal at hand, then treat the rest as supporting context rather than letting five numbers compete for attention every time.
Bringing it together
A step count is a reasonable place to start a walking habit, but it stops being useful as a progress marker once the habit is established. Pace over a known distance, heart rate at that pace, perceived exertion, incline tolerance, and recovery time each capture something the step counter cannot: intensity, cardiovascular efficiency, subjective effort, terrain-adjusted strength, and autonomic recovery. Tracked together on a simple, repeatable schedule and reviewed as a monthly trend rather than a daily score, these five markers give a far more honest picture of whether a walking routine is actually building fitness, independent of how many steps show up on a phone screen by bedtime.
Frequently asked questions
Do I need to stop tracking step count altogether?
No. Step count is still a reasonable measure of overall daily movement and a useful reminder to avoid long sedentary stretches. The point is to add capacity-based markers alongside it rather than relying on step count as the only measure of progress.
How often should I actually run the test walk?
Every 10 to 14 days is a practical rhythm for most people. Testing daily adds too much noise from sleep, weather, and stress; testing less than monthly makes it hard to catch a plateau early enough to adjust training.
What if I do not own a heart rate monitor?
Perceived exertion and pace over a fixed route can be tracked with nothing more than a phone timer and the Borg scale or a simple 0-to-10 effort rating. Both are validated, reliable substitutes for heart rate data when a device is not available.
Why does my heart rate recovery seem to change more slowly than my pace?
Heart rate recovery reflects autonomic nervous system adaptation, which tends to change over a longer timescale than muscular or cardiovascular efficiency gains that show up in pace. Expect recovery to take two to three months of consistent walking before a clear trend appears.
Should I test on hot or humid days?
It is fine to test on any day as long as conditions are logged in the notes column of the tracking template. Heat and humidity raise heart rate at a given pace, so comparing a hot-day test to a cool-day test without noting the conditions can create a misleading dip in the trend.
Is a faster pace always the goal?
Not necessarily. For many walkers, particularly older adults or those managing a health condition, a lower heart rate or better recovery time at the same pace is just as meaningful a form of progress as walking faster. The five markers are meant to be read together rather than optimized one at a time.
References
- ScienceAlert, “One Factor in Walking May Improve Your Heart Health More Than Your Step Count,” summarizing a 2025 Annals of Internal Medicine analysis of UK Biobank data. sciencealert.com
- ScienceDirect, “Prolonged heart rate recovery time after 6-minute walk test is an independent risk factor for cardiac events in heart failure: A prospective cohort study.” sciencedirect.com
- PubMed, “Criterion-related validity of the Borg ratings of perceived exertion scale in healthy individuals: a meta-analysis.” pubmed.ncbi.nlm.nih.gov
- PubMed, “Improvement in usual gait speed predicts better survival in older adults.” pubmed.ncbi.nlm.nih.gov
- npj Digital Medicine, “Evaluation of physical health status beyond daily step count using a wearable activity sensor.” nature.com
- Frontiers in Sports and Active Living, “Estimating Walking Speed in the Wild.” frontiersin.org