




























By Amara Williams
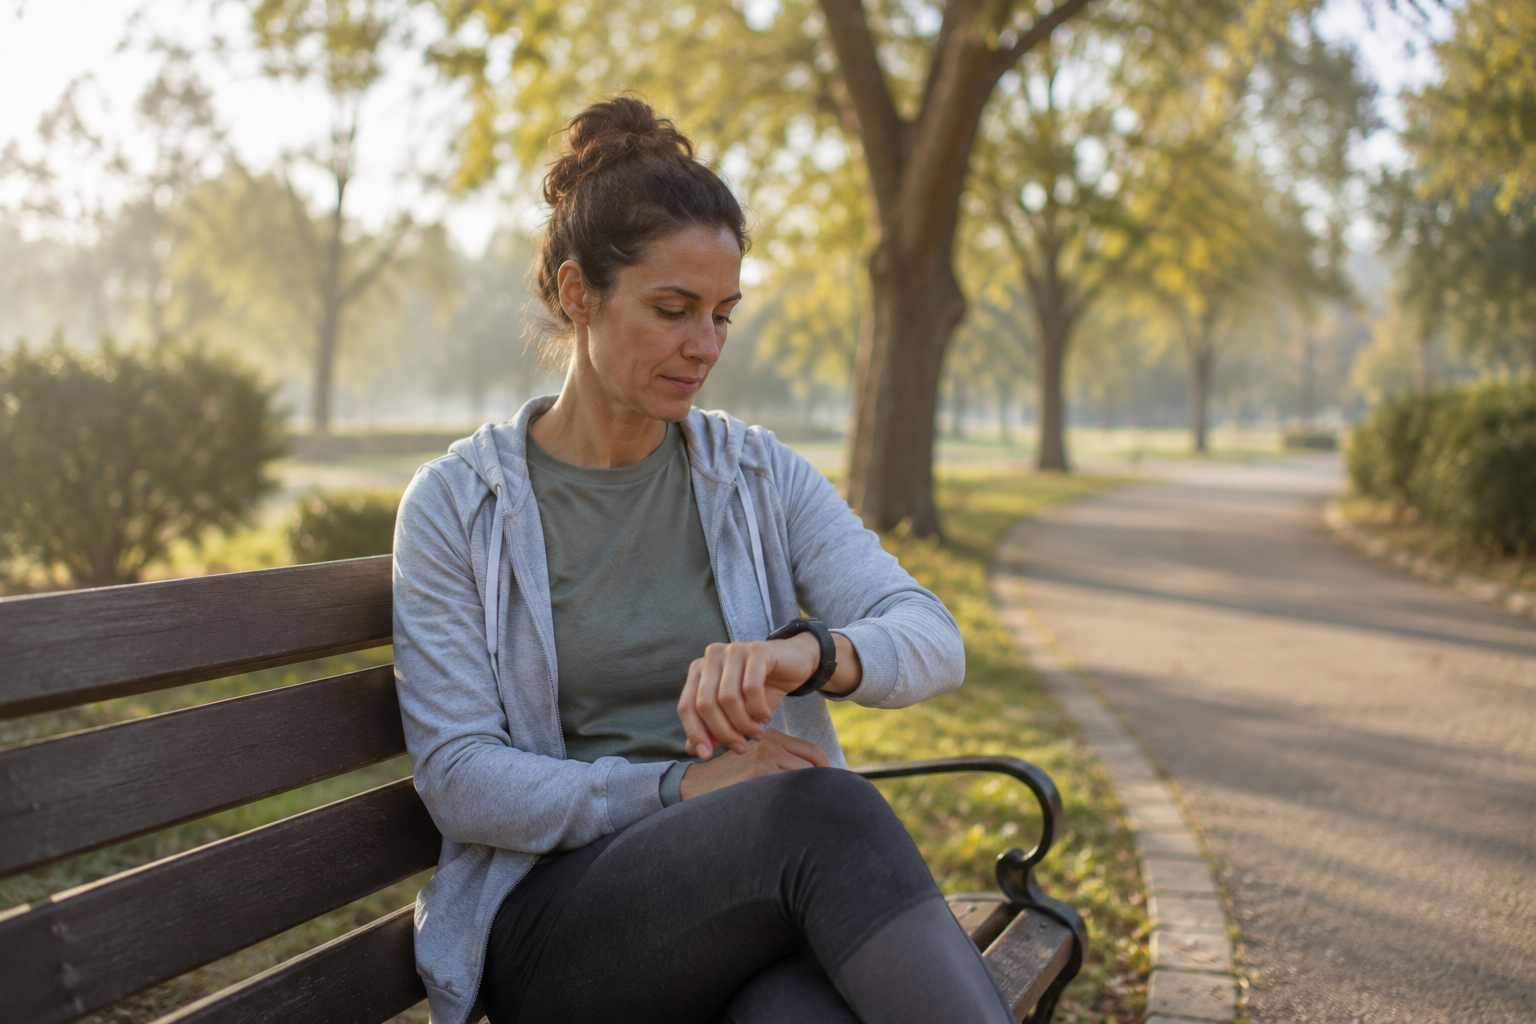
You wake up, glance at your wrist or your phone, and there it is: last night’s HRV number. It’s a little lower than yesterday. Is your body breaking down? Did that glass of wine wreck your recovery? Should you skip today’s workout? For most people who exercise regularly but aren’t chasing a podium finish, this single number has become a small daily source of anxiety, and it usually shouldn’t be. Heart rate variability is a genuinely useful signal, but only when it’s read the right way, over the right time frame, with the right amount of skepticism about any one reading.
This piece is written for ordinary exercisers, not elite athletes with a sports science team reading their charts. It explains what HRV physiologically represents, why it jumps around from day to day even when nothing is wrong, what a meaningful trend actually looks like compared with a single data point, the everyday confounders that swing the number without saying anything about your recovery, and a practical way to use the metric on your wearable without letting it run your mood.
What HRV Actually Measures
Heart rate variability is not a measurement of your heart rate. It’s a measurement of the tiny, constantly shifting gaps between heartbeats. Even at what feels like a steady resting pulse, the interval between one beat and the next is never perfectly even, it stretches and shrinks slightly, beat by beat. HRV quantifies how much that spacing varies.
According to the widely cited overview by Shaffer and Ginsberg published in Frontiers in Public Health, HRV “indexes neurocardiac function and is generated by heart-brain interactions and dynamic, nonlinear autonomic nervous system (ANS) processes” (Shaffer & Ginsberg, 2017, see References). The most common metric consumer wearables report, RMSSD (root mean square of successive differences), is described in that same paper as “the primary time-domain measure used to estimate the vagally mediated changes reflected in HRV.”
The Vagus Nerve Connection
Your autonomic nervous system runs on two competing branches. The sympathetic branch is the accelerator, it raises heart rate and prepares you for effort or stress. The parasympathetic branch, largely carried by the vagus nerve, is the brake, it slows things down and supports rest, digestion, and recovery. When your parasympathetic (vagal) input is strong relative to sympathetic input, the beat-to-beat spacing tends to vary more, producing a higher RMSSD. When sympathetic drive dominates, whether from exercise, stress, illness, or stimulants, the spacing tends to even out, producing a lower RMSSD.
“HF power indexes vagal modulation of HR, it does not represent vagal tone” — a distinction the Shaffer and Ginsberg review stresses precisely because so many people treat a single HRV reading as a direct gauge of nervous system “strength,” when it’s really an index that shifts with breathing, posture, and context.
That last point matters more than most wearable apps let on. HRV isn’t a fixed trait you’re scoring against some universal ideal, it’s a moving readout shaped by dozens of factors happening on any given day, only some of which relate to training recovery at all.
It’s also worth knowing that HRV isn’t the same across people to begin with, so comparing your number against a friend’s, or against a generic “normal range” you saw online, is rarely useful. The Shaffer and Ginsberg review notes that time-domain HRV measures decline with age, with the steepest drop typically occurring between the second and third decades of life, and that biological sex also shapes the numbers: women in the studies reviewed tended to show higher average heart rate and lower SDNN than men, alongside a different balance of frequency-domain components. None of that makes a lower reading “worse,” it just means your own history is the only fair comparison point. A 45-year-old and a 22-year-old training partner can both be recovering perfectly well while sitting on very different HRV numbers.
Why Your HRV Number Bounces Around, and Why That’s Normal
If you’ve tracked HRV for more than a week, you already know it rarely sits still. A reading of 62 ms one night and 48 ms the next isn’t a sign that something broke overnight. Night-to-night variation is an expected feature of the metric, not a glitch in your device. A 2025 reliability study in Scientific Reports that measured healthy, physically active adults across repeated home and laboratory sessions found day-to-day variability was “minimal” under standardized conditions, but also found that reliability dropped noticeably depending on body position: supine (lying down) readings showed good consistency (intraclass correlation coefficients above 0.75), while standing readings were only moderately consistent (below 0.75) (Scientific Reports, 2025, see References). In other words, even under controlled lab conditions with the same person measured the same way, position alone introduces real noise. Add in an ordinary night of interrupted sleep, a later bedtime, or a slightly different sensor fit, and some night-to-night bounce is simply expected.
The practical rule underneath that table is simple: a single reading is a data point, not a diagnosis. It takes a run of readings, evaluated against your own history, to say anything meaningful.
The Difference Between a Data Point and a Trend
This is where most people misuse HRV. They treat each morning’s number like a report card. Sports scientists who actually rely on HRV to guide training decisions do the opposite: they largely ignore single-day values and instead track a rolling average, because the single-day number is dominated by measurement noise.
A 2026 narrative review in Sensors on HRV-guided training monitoring lays out why clearly. Citing earlier work by Plews and colleagues, the review reports that week-to-week changes in weekly-averaged RMSSD correlated with performance changes at r = 0.72 to −0.76, while isolated single-day recordings correlated far more weakly, at only r = −0.06 to −0.17 (Kliszczewicz et al., 2026, see References). Among a group of female collegiate soccer players, three-week changes in the weekly HRV average correlated strongly (r = 0.90) with later fitness changes. A single day’s reading, by contrast, was described as barely more informative than noise for predicting anything useful.
The same review recommends establishing a personal baseline from at least seven consecutive days of readings taken under consistent conditions, then tracking the rolling mean going forward rather than reacting to daily swings. It also flags a second, less commonly discussed metric: the coefficient of variation (CV) of your RMSSD across a week, meaning how much your daily numbers scatter around that week’s average. In the review’s illustrative scenarios, a stable, well-adapted week showed both a healthy weekly RMSSD average and a low CV (around 2.7 to 2.8%), while a week of accumulating strain showed a much higher CV (8 to 14%) even before the average itself dropped, suggesting that increasing day-to-day scatter can show up before the average number does.
What a Rolling Baseline Actually Looks Like
Below is a simplified, illustrative example (not real study data) showing why a single day is misleading on its own, while the 7-day rolling average tells a calmer, more coherent story.
| Week | Daily Range | 7-Day Rolling Average | Reading |
|---|---|---|---|
| Week 1 | 43–65 ms | 53 ms | Baseline established |
| Week 2 | 37–51 ms | 45 ms | Meaningful downward shift (~15%), worth noting |
| Week 3 | 43–55 ms | 49 ms | Recovering back toward baseline |
Notice that individual days inside week 2 (a low of 37, a relative high of 52) still bounce around, exactly like week 1 and week 3. What changes is the average around which they bounce. That shift in the average, sustained across a week, is the kind of thing worth paying attention to. A single 37 sitting inside an otherwise normal week is not.
What Actually Swings HRV Without Meaning Anything About Recovery
Before you interpret any drop as a sign of overtraining or under-recovery, it’s worth ruling out the mundane explanations first. Several everyday factors can move your HRV reading substantially in a single night, independent of how well your body is actually adapting to training.
- Alcohol the evening before. Even moderate intake measurably suppresses parasympathetic activity during sleep.
- A shifted sleep or wake time. Measuring an hour earlier or later than usual changes the reading independent of recovery status.
- Different measurement conditions. Sitting instead of lying down, a different device, or a looser strap all introduce their own variability.
- Late caffeine or stimulants. These raise sympathetic activity and can suppress overnight HRV.
- Early illness, even before symptoms appear. Viral infection can sharply depress HRV, sometimes before you feel sick.
- Emotional stress or a heavy meal close to bedtime. Both nudge the autonomic balance toward sympathetic dominance.
- Dehydration, travel, or an unfamiliar sleeping environment. All are known short-term disruptors of normal readings.
Alcohol: A Bigger Effect Than Most People Assume
Alcohol is probably the single most underestimated confounder in everyday HRV tracking. A large observational study published in JMIR Mental Health analyzed more than 12,000 overnight recordings from 4,098 Finnish employees and found a clear, dose-dependent relationship between alcohol intake and autonomic disruption during the first three hours of sleep (Pietilä et al., 2018, see References). At a low dose (roughly 0.25 g of alcohol per kilogram of body weight, about one to two standard drinks for most adults), heart rate rose by an average of 1.4 beats per minute and RMSSD fell by about 2.0 ms compared with a non-drinking night. At a moderate dose, heart rate rose 4.0 bpm and RMSSD fell 5.7 ms. At a high dose (above 0.75 g/kg, roughly five standard drinks for an 80 kg person), heart rate rose 8.7 bpm and RMSSD dropped 12.9 ms, alongside a 39% reduction in a composite “recovery” score, equivalent to roughly 45 fewer minutes of physiological recovery during those first three hours of sleep. All effects were statistically significant (p<.001), and the researchers noted that being young or physically fit did not protect against the effect.
If your lowest HRV reading of the month happens to fall on the morning after a night out, that’s very unlikely to be a training-recovery problem. It’s the alcohol.
Measurement Time-of-Day and Sleep Timing
When during sleep (or how soon after waking) you measure changes the number too. A study of well-trained adolescent endurance athletes published in PLoS ONE compared nocturnal HRV recordings against morning orthostatic (standing) test recordings and found significantly different RMSSD values between the two methods (p<.008), even though weekly nocturnal and morning values tracked each other reasonably well over time (r = 0.878 to 0.895) (Mishica et al., 2022, see References). Practically, this means comparing a nocturnal-sleep-tracked HRV reading from one night against a stand-up morning-test reading from another isn’t really comparing like with like, the methodology itself introduces a shift. The Shaffer and Ginsberg review makes the same point more broadly, stating plainly that “24 h, short-term, and ultra-short-term normative values are not interchangeable,” and that body position, respiration pattern, and time of day are all part of the context that has to stay consistent for numbers to be comparable.
The practical takeaway: pick one method, one rough time window, and one body position, and stick with it. Consistency in how you measure matters as much as the number itself.
Illness Can Move HRV Before You Feel Anything
Perhaps the most dramatic confounder is infection. A case report published in Frontiers in Sports and Active Living tracked an elite marathon runner through a six-day upper respiratory tract infection with fever between 38.5 and 39.3°C. During the illness, standing RMSSD collapsed by 79.8%, from 20.8 ms down to 4.2 ms (p = 0.002), while standing heart rate rose 22 beats per minute (p = 0.001) (Hottenrott et al., 2021, see References). All values returned to baseline roughly ten days after the infection cleared. This is a single case, not a population study, so the exact magnitude won’t generalize to everyone, but the direction is well established elsewhere in the literature: viral illness reliably suppresses HRV, sometimes in the day or two before other symptoms show up. If your HRV drops sharply and you also feel a little “off,” that’s a more useful combination of signals than either one alone.
How to Actually Use the Number on Your Wrist
None of this means HRV tracking is a waste of time for ordinary exercisers. It means the value is in the pattern, not the ping. Here’s a grounded way to use it.
Build a real baseline first. Measure under the same conditions (same device, same rough time, same body position) for at least one to two weeks before drawing any conclusions. A single week of data is a starting point, not a verdict.
Watch the rolling average, not the daily print. A 7-day average is the minimum most sports-science guidance points to; some people prefer a 14-day window for extra stability. Either way, judge your recovery trend on where that line has moved over the past several days, not on this morning’s isolated figure.
Rule out the obvious explanations before reacting. Before assuming a low reading means overtraining, check the confounders list above: did you drink last night, sleep later or earlier than usual, travel, or feel a scratchy throat? Most single-day dips have a mundane explanation.
Look for a sustained shift, not a one-off number. A rolling average that drops and stays down across a full week, especially alongside rising day-to-day scatter (the coefficient of variation mentioned earlier), is a more credible signal than any single low morning.
Use it as one input, not a verdict. Combine the HRV trend with how you actually feel, how your workouts are going, your sleep quality, and your motivation. A number on a screen shouldn’t overrule your own read of your body, it should support it.
Keep your measurement method fixed once you’ve picked one. Whether that’s a ring worn overnight, a chest strap first thing in the morning, or an app-based finger scan before breakfast, switching methods resets your comparison point. If you do switch devices or methods, treat it as starting a new baseline rather than continuing the old trend line, otherwise you’ll misread a methodology change as a physiological one.
The goal of tracking HRV as an everyday exerciser isn’t to decode every fluctuation. It’s to notice when your normal range of bounce has genuinely shifted, and to let the mundane explanations, a late drink, a shifted bedtime, a bug going around, get ruled out first.
A Realistic Weekly Routine for Reading Your HRV
You don’t need a spreadsheet or a sports science degree to do this reasonably well. A simple weekly habit works for most people who exercise for health and enjoyment rather than competition:
- Measure at roughly the same time and in the same position most days, accepting that some days will be missed or inconsistent, that’s normal life.
- Glance at the daily number if you like, but don’t act on it in isolation.
- Once a week, look at the rolling average your app provides (or calculate a rough one yourself) and compare it with the previous week.
- If the average has moved meaningfully, ask what else changed: training load, sleep, alcohol, stress, or illness. Usually there’s an obvious answer.
- If the average stays lower for two or more consecutive weeks with no obvious explanation, that’s a reasonable point to ease up on intensity or check in with a healthcare provider, particularly if it comes with fatigue, illness symptoms, or a stalled training response.
This approach keeps the metric useful without letting it dictate your mood every single morning. HRV is a supporting data point for how you train and recover, not a scoreboard you’re supposed to win every day.
Frequently Asked Questions
Is a lower HRV always bad?
No. A lower HRV reading on any single day is extremely common and often reflects something mundane, like alcohol, a shifted sleep schedule, or a different measurement position, rather than a decline in fitness or recovery. Context and trend matter far more than any one low number.
How many days of data do I need before I can trust a trend?
Sports-science guidance generally recommends establishing a personal baseline over at least seven consecutive days under consistent measurement conditions, then continuing to track a rolling average from there. Some coaches prefer a 14-day window for extra stability, particularly for people whose schedules and sleep vary a lot week to week.
Why does my HRV look different between my phone app’s morning reading and my ring or watch’s overnight reading?
Different measurement methods (nocturnal sleep tracking versus a brief morning orthostatic test, for example) produce meaningfully different values even in the same person on the same day, because position, respiration, and timing all affect the reading. Comparing numbers from two different measurement methods isn’t a fair comparison. Stick to one method for trend-tracking.
Can I train hard even if my HRV reading is low that morning?
For most recreational exercisers, a single low reading is not, by itself, a reason to scrap a planned session, especially if you feel fine and can identify a likely mundane cause (a late night, a drink, an earlier-than-usual wake-up). Sustained multi-day drops paired with how you actually feel are a more reliable basis for backing off than one isolated number.
Does alcohol really affect HRV that much, even a drink or two?
Yes. Research on more than 12,000 overnight recordings found measurable autonomic disruption even at low doses (roughly one to two standard drinks), with the effect growing substantially at higher doses. It’s one of the most common, and most overlooked, everyday causes of a lower-than-usual HRV reading.
Should I be worried if my HRV drops sharply and stays down?
A sharp, sustained drop that isn’t explained by an obvious short-term factor (alcohol, travel, a rough night of sleep) is worth paying attention to, particularly if it’s accompanied by fatigue, a sore throat, or other early illness symptoms. In that case, easing training load and, if symptoms develop or persist, checking in with a healthcare provider is a reasonable response.
References
- Shaffer, F., & Ginsberg, J. P. (2017). An Overview of Heart Rate Variability Metrics and Norms. Frontiers in Public Health, 5, 258. https://doi.org/10.3389/fpubh.2017.00258
- Kliszczewicz, B., et al. (2026). Monitoring Training Adaptation and Recovery Status in Athletes Using Heart Rate Variability via Mobile Devices: A Narrative Review. Sensors, 26(1), 3. https://doi.org/10.3390/s26010003
- Pietilä, J., et al. (2018). Acute Effect of Alcohol Intake on Cardiovascular Autonomic Regulation During the First Hours of Sleep in a Large Real-World Sample of Finnish Employees: Observational Study. JMIR Mental Health, 5(1), e23. https://doi.org/10.2196/mental.9519
- Mishica, C., et al. (2022). Evaluation of Nocturnal vs. Morning Measures of Heart Rate Indices in Young Athletes. PLoS ONE, 17(1), e0262333. https://doi.org/10.1371/journal.pone.0262333
- Assessing the Clinical Reliability of Short-Term Heart Rate Variability: Insights From Controlled Dual-Environment and Dual-Position Measurements. (2025). Scientific Reports, 15, 5611. https://doi.org/10.1038/s41598-025-89892-3
- Hottenrott, L., et al. (2021). Utilizing Heart Rate Variability for Coaching Athletes During and After Viral Infection: A Case Report in an Elite Endurance Athlete. Frontiers in Sports and Active Living, 3, 612782. https://doi.org/10.3389/fspor.2021.612782